Monday, July 4, 2011

Understanding Stop Limit Buy Orders

For momentum trading methods such as CANSLIM, it often becomes imperative to use a buy stop order in order to get into a stock at the correct time. I place my orders through Fidelity and was confused with their variant of buy stop orders, known as the stop limit orders for the longest time until I found the following explanation from Investopedia:

What Does Stop-Limit Order Mean?
An order placed with a broker that combines the features of stop order with those of a limit order. A stop-limit order will be executed at a specified price (or better) after a given stop price has been reached. Once the stop price is reached, the stop-limit order becomes a limit order to buy (or sell) at the limit price or better.


Investopedia explains Stop-Limit Order
The primary benefit of a stop-limit order is that the trader has precise control over when the order should be filled. The downside, as with all limit orders, is that the trade is not guaranteed to be executed if the stock/commodity does not reach the stop price.

A stop order is an order that becomes executable once a set price has been reached and is then filled at the current market price. A limit order is one that is at a certain price or better. By combining the two orders, the investor has much greater precision in executing the trade. Because a stop order is filled at the market price after the stop price has been hit, it's possible that you could get a really bad fill in fast-moving markets.

For example, let's assume that ABC Inc. is trading at $40 and an investor wants to buy the stock once it begins to show some serious upward momentum. The investor has put in a stop-limit order to buy with the stop price at $45 and the limit price at $46. If the price of ABC Inc. moves above $45 stop price, the order is activated and turns into a limit order. As long as the order can be filled under $46 (the limit price), then the trade will be filled. If the stock gaps above $46, the order will not be filled.

Sunday, June 12, 2011

Ideal Time Horizon for Investing

Investing, as everyone knows, is a game of patience. You need to have the patience to ride out market busts and resist the attempt to sell during market booms. On the other hand, Traders (a.k.a speculators) have a much shorter time frame as shown below:

  • Scalpers : Less than a second to few seconds.
  • High Frequency Traders a.k.a. Algorithmic Traders : Order of miliseconds
  • Momentum Traders: minutes to few hours
  • Swing Traders : A day to a few weeks
  • Trend followers / Position Traders : Weeks to Months
The unifying factor in all these types of trading is that they rely heavily on technical analysis and trend following tactics. The odds of getting them right for *really smart* guys is about 50% !!! hence the name "Speculators". :)

Now, coming back to the topic under discussion - I started to ask myself, historically (again no future prediction involved), what is the minimum holding time for long term investors to make money - so I analyzed the rate of returns of the S&P from 1950 to 2010 in 10 year and 20 year investment horizons. The results are summarized below:


Some observations about the data above:

1. Notice how usually 2 bull market phases is followed by a Bear or Sideways market phase. This is what is effectively called "Reversion to the Mean" in efficient market hypothesis !

2. For a stretch of 10 year period, assuming you bought at the beginning of the decade and sold at the end of the decade, you'd have made money in 5 of the 6 decades, which is not bad !

3. The average ROI for a 10 year time horizon is 234%  - i.e. 100K becomes 234k

4. For a 20 year holding period, you NEVER LOST MONEY !!!

5. The average ROI for 20 year period is 533% - i.e. 100K becomes 533K over a 20 year investment period.

6. For a 30 year period, the average ROI is 955%, i.e. 100K became 955K .

Note: The above data is not adjusted for increase in CPI (inflation)

To quote Warren Buffet " Our preferred holding period is forever" - now you can see why :) Agreed, that if you're smart and can use trend following strategies, you can make a lot more money (like 2000% more over 10 years ), but you can also loose everything ! 

So, parting words of wisdom :
1. If you're in your 20's , Index investing is the best way to go. Use dollar cost averaging to get the best risk adjusted returns.

2. DO NOT, I repeat DO NOT Trade or try to use Trend Following techniques in your 401k and IRA accounts.

3. Invest money that you do not need for at least 10 years - anything shorter, and you run a big risk of loosing money if your timing is incorrect - after all, even over 10 year investing periods, you have a 17% chance of loosing money.

4. I know that you're thinking this Index investing and dollar cost averaging is for the idiots - but 20 years from now, these will be the idiots with money !

5. If the thrill of Trend following and technical trading really excites you, divide your portfolio as follows:
A. Retirement Accounts : These includes IRA and 401K - index investing is the way to go.
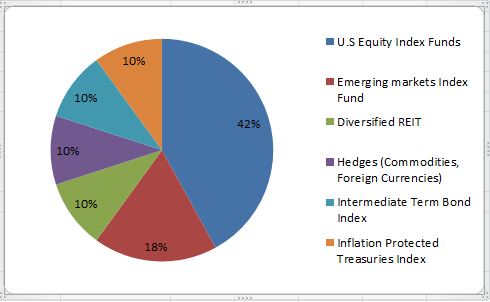
B. Brokerage Investment Account: Typically here you'll save for a specific goal like buying a house. Use conservative investing practices. An example Portfolio(assuming you're in your 20s and 30s)  is given below:


C. Brokerage Speculative Account : This is the FUN PART ! And after all, this is what this blog is all about. Note that you should not speculate with more than 10% of your portfolio !

Well, hopefully you have a better grasp of what "Long Term Investment" means after reading this article - where you go from here - is a path you have to choose !

Sunday, April 10, 2011

ROI on stocks vs bonds vs gold - a brief history of the market.

Ever wondered what brings the highest ROI in long term - stocks, bonds or gold ? If you did, you're not the first one to think in those lines :) as always - a chart is worth a thousand words - have a look below:

Figure  1.2 , based on a chart created by Professor Siegel for his fine book 
Stocks for the Long Run ,demonstrates that stocks have provided the highest
 rate of return among the major categories of financial assets: stocks, bonds,
U.S. Treasury bills, and gold. This graph covers the entire history of the American
stock market, from 1802 to 2008. An initial investment of  $ 10,000 in stocks,
 from 1802 on, with all dividends reinvested (and ignoring taxes) would have
resulted in a terminal value of  $ 5.6   billion  in real dollars (after adjustment
for infl ation). The same initial investment in long - term U.S. government
bonds, again reinvesting all interest income, would have yielded a little more
 than  $ 8  million. Stocks grew at a real rate of 7 percent annually; bonds,
at a rate of 3.5 percent. The signifi cant advantage in annual return (compounded
over the entire period) exhibited by stocks results in an extraordinary difference
in terminal value, at least for an investor with a time horizon of 196 years.


So it begs the question, when is day trading worth your time and efforts - from
above we can see that day trading is worth it if and only if your annualized
returns adjusted for inflation can bring in more than 7%. Anything less and
you'd be better off putting your money in stock funds which have experienced
steady growth rates in long time horizons:


Per Dr.Alexander Elder, the best money managers on wall street bring
in an ROI of 25% annually - this is the number to shoot for if you're day
trading.If you are closer to 10-14 %, then investing in a well chosen mutual
 fund is probably save you time, money and a lot of headaches.

Sunday, March 27, 2011

Managing Risk like a professional

Gil Morales, a practioner of CAN SLIM trading strategy , whose personal account return was
10,904.25% between January 1st, 1998 to December 31st, 2005, has a simple policy for managing risk:

"I have very few eggs in my basket, first of all, and I watch them very carefully! I use a standard stop-loss of 6-7% on any initial position, and once I am up 20% or more on a stock, I never allow my average cost to get to a point where the stock is not trading at least 20% above that average cost. If the stock starts coming in, I trim any portion of the position I purchased at higher prices to bring my average cost down and bring the position back in line with respect to my average cost. I use a LIFO method of accounting to keep track of my cost basis."

Full Interview: http://seekingalpha.com/article/83581-buffett-lynch-morales-q-a-with-gil-morales

Wednesday, March 16, 2011

TRADING WITH THE CLOCK

If you're daytrading, I'm sure you've wondered if there are particular times you should avoid placing trades. You bet there is !!! Toni Turner gives us a dissection of the market timings and their implications during the trading day.

9:30 AM : Equities market open

9:45 AM to 10:10 AM : First reversal period. At 10:10 AM , give or take a few minutes, strong stocks that have pulled back slightly on a bulish day will again turn up. Bearish stocks that went up slightly, start trending down again.

11:20 AM: Begining of lunchtime lethargy - instituitional traders leave their desk for lunch - stocks tend to fall
off - active traders lock in profit by 11:30
        AVOID ENTERING POSITIONS DURING LUNCHTIME - LOCK IN PROFIT BEFORE LUNCH - THE STOCKS MOVEMENT, IF ANY , IS WHIPPY AND ERRATIC DURING THIS TIME.

1:30 PM : Lunchtime lethargy begins to clear - some stocks start to edge up for afternoon session.

2:30 PM : Stocks break out (or down) in a more definitive manner

3:00 PM : Treasury bonds stop trading; market breathes a sigh of relief, possible shift in direction

3:20 PM : Active traders begin to close out positions of the day

3:30 PM: Mild reversals possible

3:55 PM: Additional reversals possible as more positions closed

4:00 PM: Equities market closes

This of course comes with the standard disclaimers:
a. Trust but Verify
b. This always works , except when it doesn't. ;)

Saturday, March 12, 2011

Trade Like An O'Neil Disciple - Part I

To be perfectly honest, I've always been a believer of stock Fundamentals and kind of felt little uncomfortable trading on pure Technicals - I'm always afraid that I'll get into a stock that skyrockets on public Euphoria and then once people realize it has weak fundamentals, decides to try bungee jumping.

Having read Darvas's work - which was obviously Techno-Fundamental in nature, but with lack-lusture guidance in terms of implementation - I was looking for a knowledge source that'll help me replicate Darvas's style of trading/investing. Finally after a lot of research, William O'Neil seemed to be a great candidate. I just found a copy of Trade Like An O'Neil Disciple in Safari Books and started reading it.

Here's the first lesson:

a key but obvious point that ensures that you will not fall in love with your stock and hold it past its prime. Buy based on both fundamentals and technicals, but sell purely on technicals. Technical action should always be the final judge when selling a stock.

Saturday, February 26, 2011

Stop Loss orders can be indicative of a bear market!

Darvas's box system had been working well for him for a while when suddenly in 1957, he found that he was stopped out of most of his positions upto the point where he did not have a single position left. Perplexed, he started to wonder if his system is failing. But as it turns out, a Bear market was just around the corner !

Darvas writes:

"
But no opportunity seemed to appear. What I did not know was that we were at the end of one phase of the great bull market. It was several months before this became evident and it was declared a bear market. Half the Wall Street analysts still discuss it. They say it was merely an intermediate reaction —a temporary halt in the rising market. They all agree, however, that prices collapsed.

Of course all these opinions are expressed by hindsight— when it is too late. The advice to get out of the market was not available when one needed it.

I recall the case of Hitler when he decided to invade Stalin­grad. To him it was just another Russian town to be conquered and occupied. Nobody knew while the battle of Stalingrad was being fought that it was the turning point in the war. For a very long time, few people realized it.

Even when the German armies were halfway back, it was still talked about as strategic withdrawal. It was, in fact, the end of Hitler. The Nazi war bull market ended the day Hitler attacked Stalingrad.
In the same way, I realized that it was impossible for me to assess great historical turning points in the market when they began to happen. What fascinated me, as Wall Street prices continued to fall, was the gradual realization that my system of ducking out quickly with my stop-losses made such an assess­ment unnecessary.
I made the joyful discovery that my method had worked much better than I had dreamed. It had automatically released me well before the bad times came. The market had changed - but I was already out of it.

The most important aspect to me was that I had absolutely no hint whatsoever that the market would slide. How could I have had any information? I was too far away all the time. I had listened to no predictions, studied no fundamentals, and heard no rumors. I had simply gotten out on the basis of the behavior of my stocks.

Later when I studied the stocks I had sold automatically, I found that they subsequently slid down very low indeed in the recession period.

Look at the following table:

1957
I sold at
1958
Lowes price
1956
Highest price
BALTIMORE & OHIO5522⅝45¼
DAYSTROM42¼3039¾
FOSTER WHEELER59½25⅛39⅛
AEROQUIP27½16⅞25¾
ALLIED CONTROL48¼33½46½
DRESSER INDUSTRIES54½3346⅝
JOY MANUFACTURING683854½
ALLEGHENY LUDLUM56½30⅛49⅜


When I looked at this table, I thought this: If my stop-losses had not taken me out of the market I could have lost about 50% of my investment. I would have been like a man in a cage, locked in with my holdings and missing my opportunity to make a fortune. The only way I could have escaped would have been by smashing out, taking a 50% loss, possibly ruining my­self, and gravely impairing my confidence for future deals.

I could, of course, have bought these stocks and "put them away.'* This is a classic solution among people who call them­selves conservative investors. But by now I regarded them as pure gamblers. How can they be non-gamblers when they stay with a stock even if it continues to drop? A non-gambler must get out when his stocks fall. They stay in with the gambler's eternal hope of the turn of a lucky card.

I thought of the people who paid 250 for new york central in 1929. If they were still holding it today it was worth about 27. Yet they would be indignant if you called them gamblers! "